Hardware Aided Real-time online White-box/Development and Testing Tool CRESTS/H-Test
On the basis of having static analysis analysis to softwares, as the tool specially designed for the analysis and tests of embedded system softwares, CRESTS/H-TEST has been widely applied in embedded software on-line dynamic testing by module makers. H-TEST has adopted with the system structural frame of hardware aided software and advanced technologies of plug-in mounting; and use adapter or stylet to connect to the tested system directly; and get signals from the bus of target board , and provide a high efficiency solution of real-time online for tracing embedded application program and analyzing software performance, memory revelation and also testing software coverage rate. H-TEST has plug-in mounting to source codes. Moreover, it has a little influence on the system, and made the largest independency of the system. Its mode is very fit for embedded systems.
Software real-time online testing tool H-TEST has mainly completed the following functional items:
Program static analysis and checking function:
¡ñProgram analysis and checking function supports the checking of code programming rules, and has warning on the codes that have effects on program structuring.
¡ñProvide program control flow diagram£¬program control flow outline diagram, program call tree, program called tree, program perniciousness recursion and so on.
¡ñProvide multiple metrics(such as McCabe circle complexity, program skip number, program fan in/fan out number, program comment rate, program call depth, program length, program volume, program call & called description and so on ) of measuring program quality
¡ñPerformance analysis
For embedded real-time systems, performance quota is vital. Optimizing performance refers to that under the circumstance of unchangeable system resource(such as: memory capacity, CPU clock frequency ), the relevant measures are taken to improve the performances of system response speed, execution efficiency and so on
Performance analysis provides scientific basiis for optimizing performance. It is mainly tracking and detecting to module call relationship and branch call frequency, and display the information of their execution time, call times and so on in real time, so as to make us find system bottleneck easily.
H-TEST can monitor the whole application program accurately at the same time, and detect the bottleneck location of program execution. And also the time error is not more than 10ns. Therefore it can monitor the execution of each subprogram in a large program.
H-TEST can accurately calculate the execution time of each module, and also can list their maximum, minimum and average & accumulated execution time. H-TEST performance analysis can provide basis for the optimization of embedded application programs; through optimizing the calculation rules of key functions and adjust optimization call interface to make software engineers pointedly optimize some key functions or modules and improve the general performance of the whole software.
Advantages:
¡ñThe module quantity that can be measured simultaneously is not limited; productivity is improved, and it is no need of having local measurement by imagination, moreover having complex & boring settings and measurements of many times.
¡ñTotal trace mode, collect total data, precision is improved.
¡ñHigh-frequency timing clock, time error is not more than 100ns
Test coverage analysis
Code coverage rate indicates that which codes of the tested software have been executed and which ones have not been executed during test exectution. An important way of improving software testing validity is to monitor efficiently code coverage rate during software testing process. Through code coverage state of the tested software during test execution, the completion extent of the current testing can be known, moreover can judge the execution extent of our test, such as complete or not, amendment or not; rapidly recognize omissive test data and provide basis for testers to control test process and add test cases.
Coverage rate quotas calculated by H-TEST according to the target codes of the tested software, that include:
¡ñstatement coverage
¡ñbranch/judgement coverage
¡ñMC/DC
H-TEST provides various modes of program entire general situation, function series codes and source series coverage trend for observing software coverage state. As for it is a completely interactive tool, testers can simultaneously trace coverage state when operating to the system.
H-TEST coverage rate information includes all the contents really executed by the program, but not the sampling results; it can differientiate on-duty and off-duty codes, and can trace continuously in a long time, moreover the tracing depth is not limited, that is specially adequate for testing large embedded softwares.
Trace function
H-TEST provides code trace and variables/address trace function.
H-TEST makes a record of program real running process to make sense of the real situation of program running. The tool can provide single-step simulation program running and display function call links from two different abstract levels: a). high level, the entrance and export; b). source code level, displaying each executed statement. Moreover, the maximum trace depth is not limited ( only limited by hard disk capacity) ;
H-TEST also can trace the variable situations of variables/addresses in the program. The record content during trace process includes: when are variables/addresses having changes; the codes being executed during having changes.
By utilizing the above trace functions, the working efficiency of software developers can be rapidly improved.
Dynamic memory allocation analysis
H-TEST can monitor dynamic memory allocation information of target codes in real time, display memory allocation and memFree situation of each function and each memory allocation point; and meanwhile monitor the errors of dynamic memory allocation, analyze and count service conditions of dynamic memory, allocation and free information, the maximum value of allocation and the current value. Moreover, it can rapidly & exactly confirm the problem of memory revelation and which function or which line codes cause. It provides powerful basis of strategic decision for improving and optimizing memory allocation tactic.
H-TEST provides a real-time online high-efficiency solution for tracing embedded application programs, analyzing software performances, testing software coverage and bank dynamic allocation and so on.
H-TEST System Connection Physical Diagram
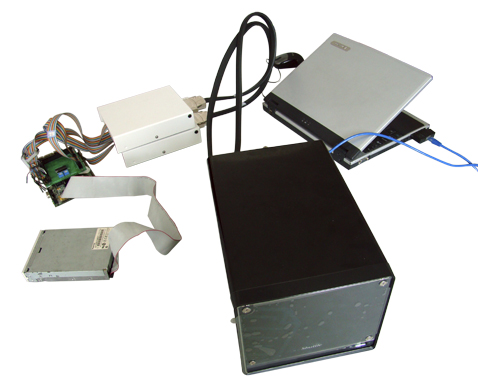 Diagram1 System components physical diagram
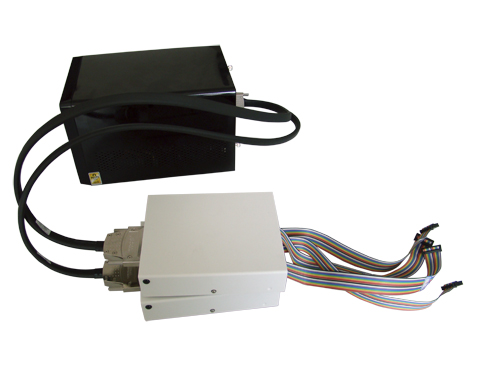 Diagram 2 H-TEST Physical connection diagram
H-TEST includes two parts, that are data processing unit and data collection
a) data processing unit
Data processing unit is responsible for collecting data from target computers, and sending data to data processing unit after collection; the junction box connected with data collection unit is responsible for connecting with target board bus.
The bus is divided into two modes of standard line and fly line; as follows is the diagram, that is standard 20pin pin mode and nonstandard fly line mode.
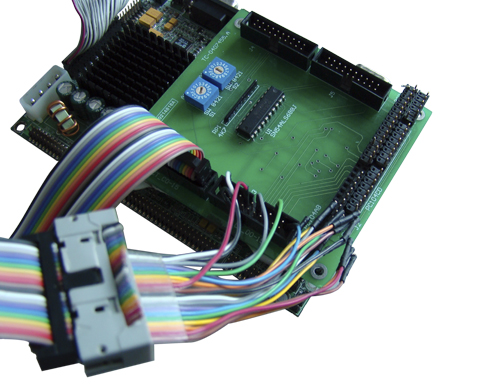 Diagram 3 Standard bus and fly line connection diagram